Connor Smyth
What are the real-world applications of NFL prediction models?
What is the purpose of this analysis?
The purpose of this analysis is to determine the real-world applications of four National Football League Prediction models and compare which one is most successful for the 2018 regular season. The four models in question are Elo, created by Five-Thirty-Eight; Football Power Index, produced by ESPN; Bing Predicts, created by Microsoft; and Amos, created by Trevor Bischoff. These prediction models can be used by people to try to make bets based on them using their intuition and knowledge as well, but this study’s goal is to find a way to use these models without any human intuition or human decision making in the process. The goal is merely to find a way to use these models to make money through sports betting formulaically. There are other potential real-world applications for these prediction models, but those focus more on the sports management side and not on the average person’s uses.
How the NFL works?
The National Football League consists of thirty-two teams from two equally divided conferences, National Football Conference and the American Football Conference. Each team plays sixteen games per season over seventeen weeks. Each team has one ‘bye-week’ in which they do not play. In total there are two-hundred-fifty-six games played in the regular season. The NFL also has four pre-season games and twenty-one playoff games, but this study is only concerning itself with the regular-season games.
A tie occurs in an NFL regular-season game when, after one ten-minute overtime period, both teams have equal scores. The NFL counts a tie as a half-win and a half-loss. For this study, because the prediction models use a binary win or loss to improve their prediction rates, a tie will be counted as a loss.
Let’s look at the betting models.
Elo, created by Five-Thirty-Eight’s Nate Silver, is one of the prediction models used in this study. It is based on Arpad Elo’s rating system for zero-sum games and is used by American Football and many other major-league sports to rank teams.
Football Power Index, created by ESPN, is another prediction model used in this study. FPI measures the strength of a team and determines each team’s rating based on a function where the parameters are the offensive, defensive, and special teams’ values. The FPI model has been, in the past, critiqued for not having a very stable and measurable formula. Instead, it appears to change week by week and therefore brings into question how much human involvement there is compared to other prediction models.
A small team of computer scientists at Microsoft created Bing’s prediction software for NFL games. Bing Predicts considers many factors down the level of turf type. What Bing considers that other models do not is what Microsoft dubs, “the wisdom of the crowd”. Through partnerships with various social media platforms, Bing Predicts can take aggregate data from users posting their thoughts about game results. This involvement adds a human element to the equation, but it is different than the suspected human involvement with ESPN’s FPI because, with Bing Predicts, one can assume that there is no one or group of individuals that are directly changing the predictions made. Instead, because Bing Predicts aggregates the data it collects, its human involvement is limited to how the machine learning algorithm interprets that data.
It is a statistical model designed to predict the outcomes of each NFL game. Amos takes into account 224 different data points to compute three different probabilities for each game. First, Amos calculates the probability of each team winning. The dashboard below then displays the team which has the highest likelihood of winning. Second, given the spread that has been assigned to a particular game, Amos calculates the probability of that team covering the given spread. Finally, given the Over/Under assigned to a particular game, Amos predicts the probability of both teams’ combined scores to break that threshold.
Trevor Bischoff, regarding Amos
Compared to the other models used in this report Amos is the most independent since there is no support from a large corporation like all the other models.
What data are we working with?
The initial data that this analysis uses, provided by Trevor Bischoff, the creator of Amos, includes all the wins, losses, predictions, and correct predictions for all four models used. The moneyline betting data source is from fantasydata.com.
The models that were most successful in making accurate predictions were Bing Predicts and the Football Power Index (FPI) with one-hundred-sixty-five correct predictions. The model that was least successful was Amos with one-hundred-fifty-one correct predictions, which makes the difference between the most successful and least successful model only fourteen predictions. Elo came in third with the most successful predictions with one-hundred-fifty-nine. Below you can each model’s weekly success compared to the average of all of them.
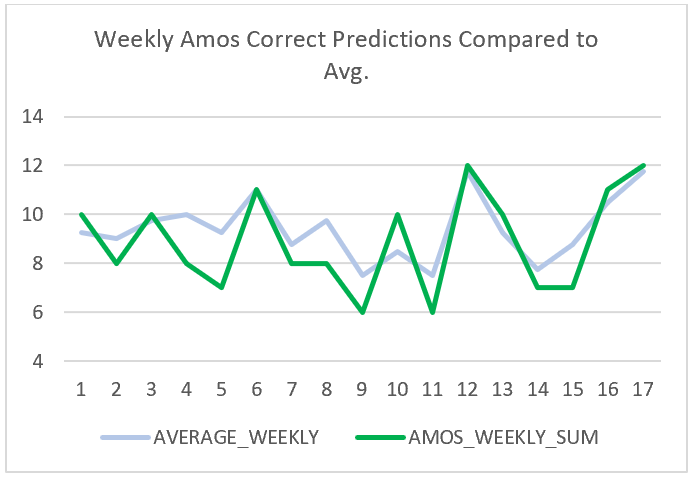
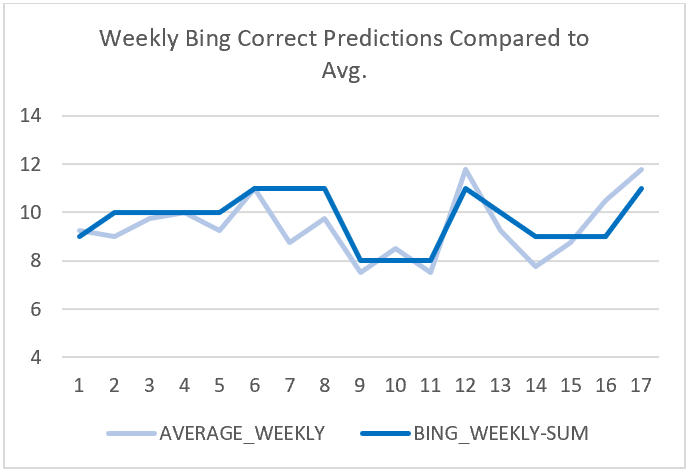
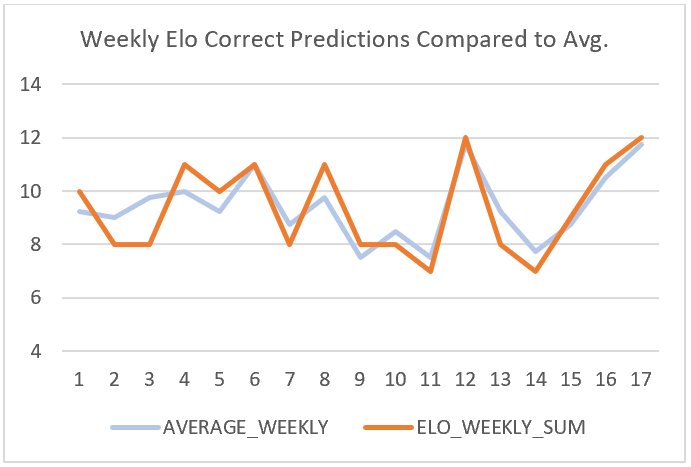
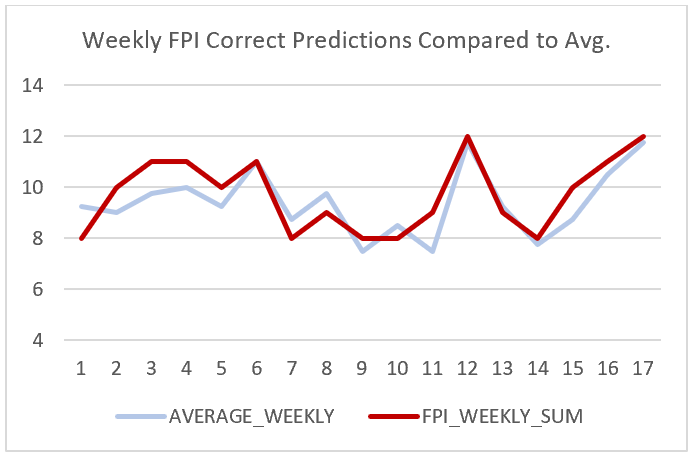
From this data, we can point out two specific weekly averages that stood out in the data. One occurred in week seven and the other in week ten. In week seven, Bing Predicts had an overall roughly seventy-nine percent of correct predictions for that week when every other model in that week had approximately fifty-seven percent of accurate predictions. In week ten, Amos had a success percentage of roughly seventy-one percent when all other models had a success rate of approximately fifty-seven percent.
It is also essential to analyze the success rates for each model based on the ranges of the specific predictions. It would make sense that the models would have the least success for forecasts with only a fifty to fifty-nine percent confidence and most success for predictions between eighty and one-hundred percent confidence.
What is sports betting?
Sports betting is a type of gambling that involves predicting the outcome of specific games. For American Football there are three main types of gambling done for each event, point spread, moneyline, and over/under betting. This analysis will be utilizing only the moneyline betting type. Moneyline bets are the simplest form of sports gambling since bettors are just making predictions on who will win the game. In a moneyline bet there is the favourite and the underdog, but sometimes there can be two favourites and no underdog. The favourite bet lists with a minus (-) sign and the underdog bet lists with a plus (+) sign. If a bettor chooses to place a bet on the favourite to win, they must pay the bet listed with the minus sign, and if they are correct, then they are paid out one hundred dollars. If a bettor chooses to place a bet on the underdog to win, they must pay one hundred dollars, and if they are correct, then they are paid out whatever the amount listed beside the plus sign is.
To demonstrate this, we will be using the game played on September 9, 2018, where the Baltimore Ravens played the Buffalo Bills. The moneyline bet would have displayed as follows:
Baltimore Ravens -340
Buffalo Bills +310
In this case, if you were to make a bet choosing the Baltimore Ravens to win you would pay the amount of three hundred forty dollars, whereas if you were to make a bet for the Buffalo Bills to win then, you would pay the amount of one hundred dollars. Because the Baltimore Ravens did win this game, if you had selected them, you would be given back your three hundred and forty dollars, and you would receive a payout of one hundred dollars. If you had chosen the Buffalo Bills, you would not receive anything and will have lost your one hundred dollars.
How does the simulation work?
For this analysis, we decided to build a simulation that would take all the prediction models and determine which one would have the highest return on investment if you ran a formulaic betting system based on each one. It is important to emphasize that the data set, for each model, only showed what the home-team-win-prediction is. What this means is that if a model predicted the away team to win with a sixty-four percent confidence, the data set would show the home team confidence for winning to be forty-six percent.
The initial simulation was required to merely apply the moneyline betting to each model individually for every game. Below you can see the pseudocode used for the simulation to deduct the betting amounts for every game.
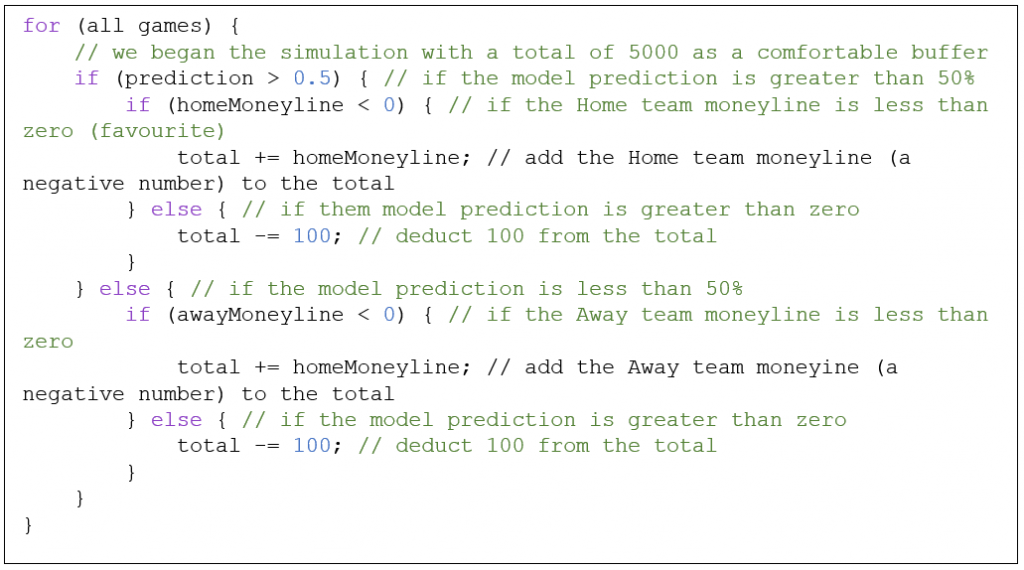
The purpose of this bit of code is to, for every game, determine whether the model has selected the home or away team to win, then deduct the appropriate moneyline bet to the total amount of money held by the simulation. The simulation was given a starting amount of five-thousand dollars in hopes that it would not drop into the negatives at any point.
What are the results of the simulation?
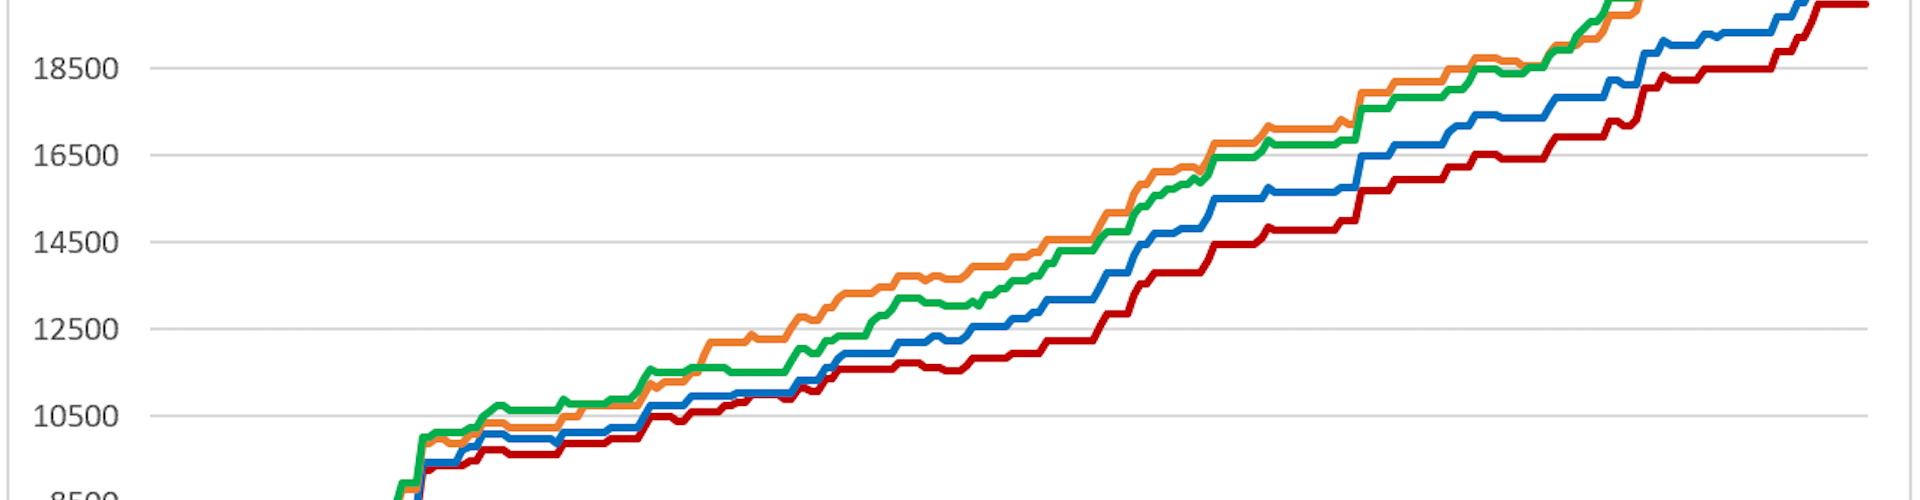
What the results of this basic simulation taught us confirmed our thinking that a loss by a team favourited to win could drastically decrease the total amount of money the bettor has. As this occurs more and more, the more and more money, the bettor loses.
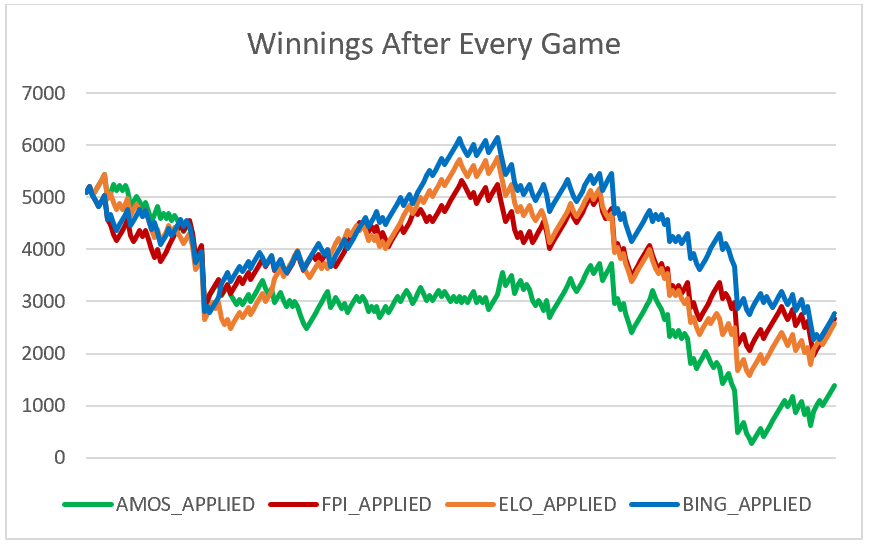
From the chart above we can see that following this sort of simulation would be analogous with following an unpredictable stock. Even though one of the models has profitability for a period, it is not stable enough to use this simulation to make money.
The next simulation we decided to try was to break up each model’s predictions into groups based on the range of the prediction’s confidence. Each model’s predictions were broken up into the ranges of fifty-one to fifty-nine, sixty to sixty-nine, seventy to seventy-nine, and eighty to one-hundred percent confidence. The reasoning for this is because the accuracy of the predictions was increasing for almost every model as its confidence increased.
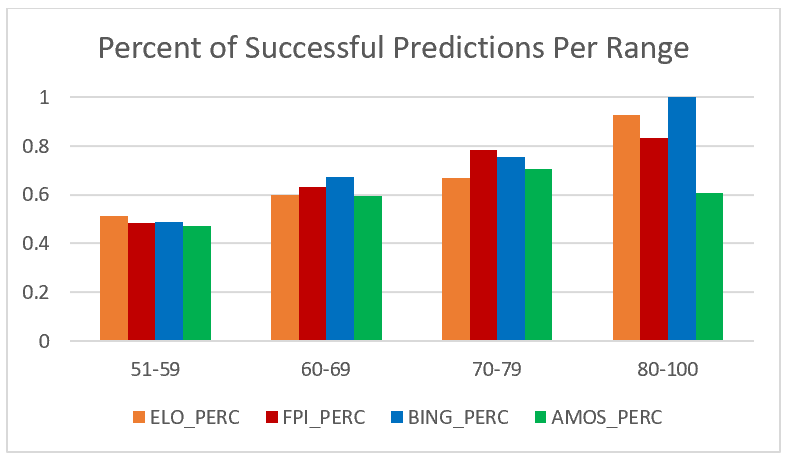
This trait is what you would hope for in the models because the higher the confidence level, the more accurate its predictions should be. You can see above the chart that displays each model’s success percentages based on the four ranges.
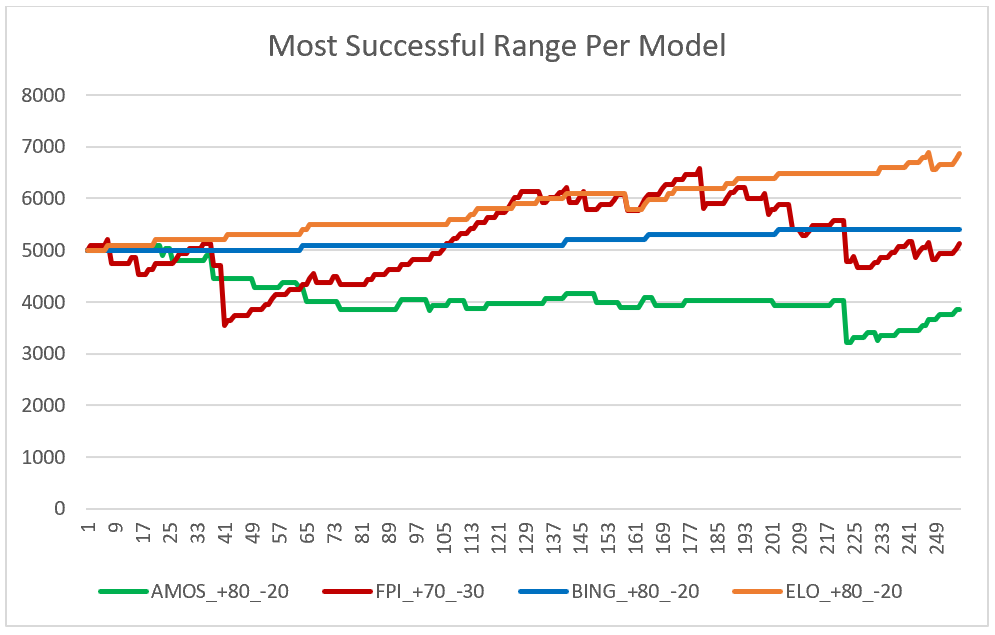
From the data above you can see that three of the models finished with profitability, but one stood above the others as the most profitable platform. It is interesting to note that three of the models’ most profitable range is what is considered the most conservative betting range, above 80% confidence level. While you could follow this simulation on the Elo model as your betting model, the concern would be that the profit margin is not significant enough to warrant the same success in the following seasons. The other issue is that this simulation cannot be applied to all four models to achieve profitable success, which is the goal of this analysis.
But since this only occurs when betting on the favourite to win, we decided to simulate as though you were betting on the underdogs. This type of simulation is compelling because if the model is incorrect, the loss is only one-hundred dollars, but if the model is correct, then the gains can be much more.
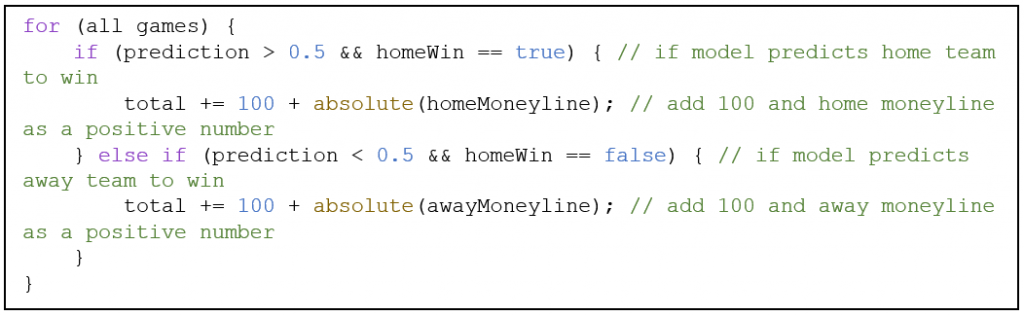
This simulation is done based on the first simulation but with restrictions on what it can make bets. The simulation checks to see who the model predicts to win a particular game and then checks to see if that prediction is the underdog money line bet. If it is, the simulation makes the appropriate one-hundred-dollar bet, but if it is not, it does nothing. The simulation then runs through each game applying the winnings appropriately. Once again, the simulation began with a total of five thousand dollars for each model as a general comfort room so that it would not dip below zero, meaning the casino is owed no money.
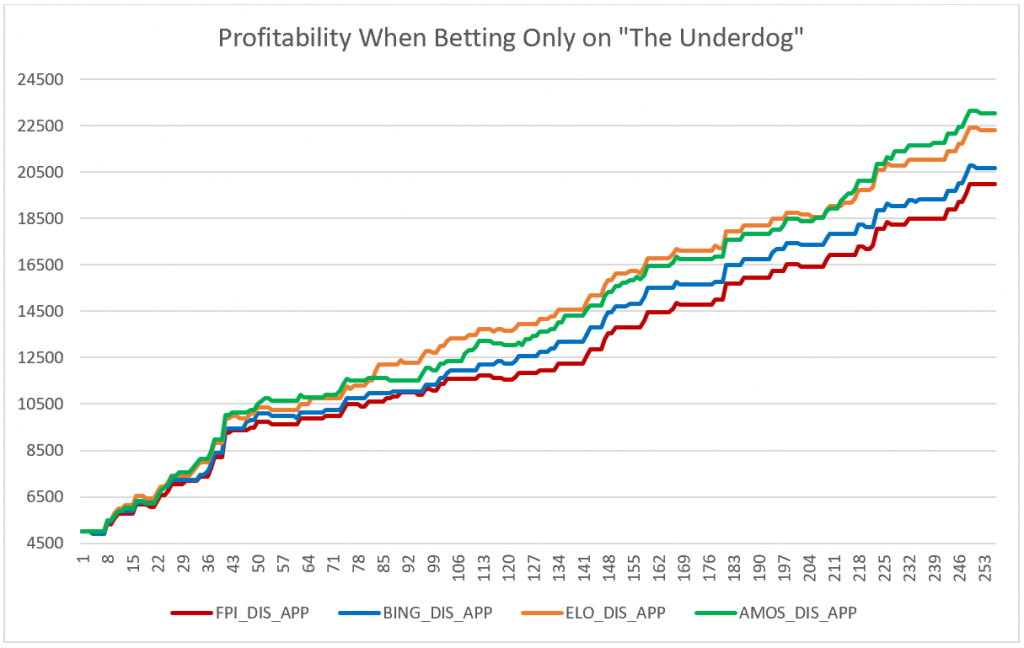
What is most surprising after running this simulation is which model is most profitable. Amos through every other analysis and statistic was the worst performing model, except for its selection in underdog moneyline bets. What is desirable about this simulation is that all models are significantly profitable and have a generally similar success rate. What is also interesting to note is the models that have some human involvement, whether aggregate or intentional, had the smallest profitability.
This simulation works by betting one-hundred dollars per game, but if the bettor so wished they could make all their bets as two-hundred dollars per game and the total amount would be twice the winnings minus the initial starting five-thousand dollars.
Because Five-Thirty-Eight has publicly accessible data on their GitHub page regarding their old Elo predictions, we decided to run the same successful analysis on every regular season including and after 2015 to determine if this strategy was just a single season phenomenon or it was generally applicable. This analysis excludes the data from the 2018 season as we have already analyzed that.